Conditional Probability Example
Example
Research data:
- 1% of al members of a population are infected with DIS
- a medicine company offers a test and claims that for this test
- TPR (true positive rate) = 0.999
- FPR (false positive rate) = 0.005
By definition:
TPR = P(TEST = POS | TRUTH = POS)
FPR = P(TEST = POS | TRUTH = NEG)
The question is, if a person is tested POS, what is the probability
this person actually is infected (is POS).
In other words, what is P(TRUTH = POS | TEST = POS)?
Or: what percentage of the people who have tested POS are really
POS?
This can be displayed in a tree-diagram (study this tree-diagram
carefully, be sure you understand the ‘translation’ from the context to
the tree-diagram).
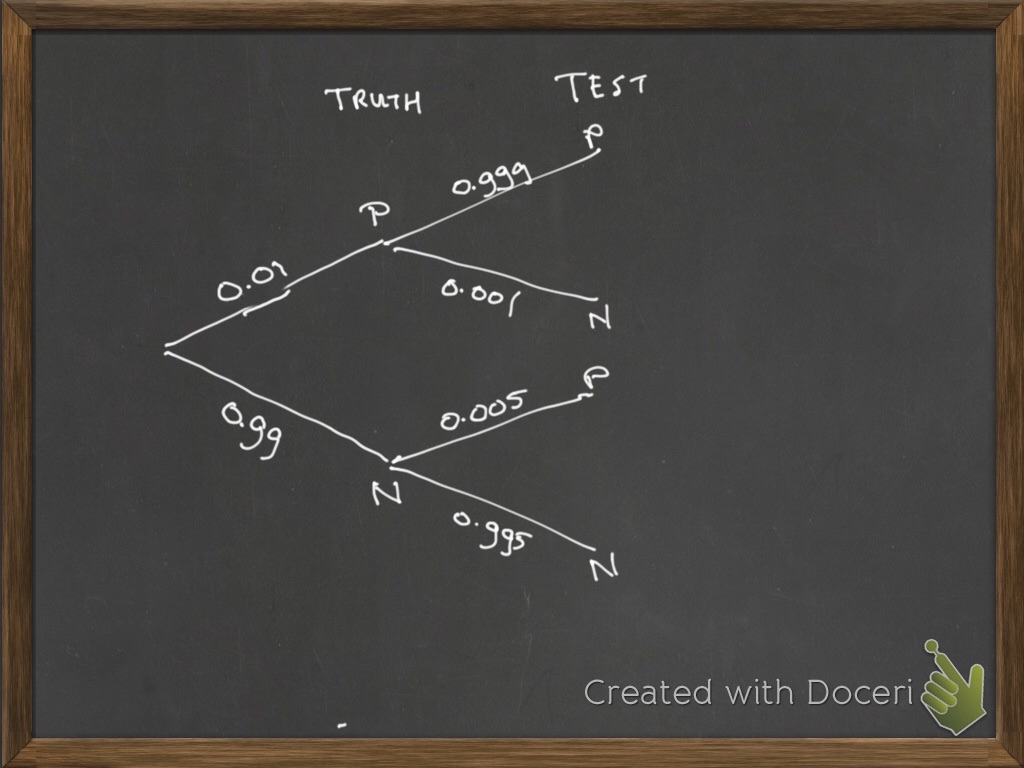
Using this tree-diagram, it is possible to calculate other
probabilities as well, e.g. what is the probability a random chosen
person is POS and the test is POS?
\(P(TRUTH = POS ~ \cap ~ TEST = POS) = P(TRUTH
= POS) \times P(TEST=POS \mid TRUTH = POS) =\) \(=0.01 \times 0.999 = 0.00999\)
Or: what is the probability that a random person is tested positive,
i.e. what is P(TEST = POS)
\(P(TEST = POS) = P(TRUTH = POS ~ \cap ~ TEST
= POS) + P(TRUTH = NEG ~ \cap ~ TEST = POS) =\) \(= 0.01 \times 0.999 + 0.99 \times 0.005 =
0.01494\)
Now it is also possible to calculate the probability that a random person who is tested POS is really POS.
\(P(TRUTH = POS \mid TEST = POS) = \frac{P(TRUTH = POS ~ \cap ~ TEST = POS)}{P(TEST = POS)} = \frac{0.00999}{0.01494} = 0.6687\)
As can be seen, this test is not really good in detecting a POS case, i.e. for a random selected and tested person, a POS test result doesn’t gives strong evidence that this person is infected.
How about detecting a NEG case?
\(P(TRUTH = NEG \mid TEST = NEG) = \frac{P(TRUTH = NEG ~ \cap ~ TEST = NEG)}{P(TEST = NEG)} = \frac{0.99 \times 0.995}{0.01 \times 0.001 + 0.99 \times 0.995} =\) 0.9999898 \(\approx\) 0.99999
Conclusion: this test is very useful to detect NEGATIVES; for
POSITIVES an additional test is needed.
Such kind of a test can be very helpful as a home test, if tested NEG
you can be quit sure that the truth is NEG as well; if tested POS, go to
a test centre for an additional test.
The probabilities can also be calculated based on the expected numbers in each group in a population of 100,000 people (or another large number). Set op a two-way table based on the given probabilities and calculate the requested probabilities.
| TRUTH | TOTAL | |||
|---|---|---|---|---|
| POSITIVE | NEGATIVE | TOTAL | ||
| TEST | POSITIVE | |||
| NEGATIVE | ||||
| TOTAL | 1,000 | 99,000 | 100,000 |
\(TOTAL(TRUTH = POS) = 0.01 * 100,000 =
1,000\)
\(TOTAL(TRUTH = NEG) = .....\)
\(TOTAL(TRUTH = POS ~ and ~ TEST = POS)
=\)
\(=TOTAL(TRUTH = POS) \times P(TEST = POS \mid
TRUTH = POS) = 1,000 \times 0.999 = 999\)
\(TOTAL(TRUTH = NEG ~ and ~ TEST = POS)
=\)
\(=TOTAL(TRUTH = NEG) \times P(TEST = POS \mid
TRUTH = NEG) = 99,000 \times 0.005 = 495\)
Enter these numbers into the two-way table.
| TRUTH | TOTAL | |||
|---|---|---|---|---|
| POSITIVE | NEGATIVE | TOTAL | ||
| TEST | POSITIVE | 999 | 495 | |
| NEGATIVE | ||||
| TOTAL | 1,000 | 99,000 | 100,000 |
Now the remaining numbers can be filled in quite easily.
| TRUTH | TOTAL | |||
|---|---|---|---|---|
| POSITIVE | NEGATIVE | TOTAL | ||
| TEST | POSITIVE | 999 | 495 | 1,494 |
| NEGATIVE | 1 | 98,505 | 98,506 | |
| TOTAL | 1,000 | 99,000 | 100,000 |
As a final step calculate the required probabilities.
\(P(TRUTH = POS \mid TEST = POS) = \frac{999}{1,494} = 0.6687\)
\(P(TRUTH = NEG \mid TEST = NEG) = \frac{98,505}{98,506} = 0.99999\)